Today, data mining applications are available on all size systems for mainframe, client/server, and PC platforms.
System prices range from several thousand dollars for the smallest applications up to $1 million a terabyte for the largest.
Enterprise-wide applications generally range in size from 10 gigabytes to over 11 terabytes.
NCR has the capacity to deliver applications exceeding 100 terabytes.
There are two critical technological drivers:
- size of the database: the more data being processed and maintained, the more powerful the system required;
- query complexity: the more complex the queries and the greater the number of queries being processed, the more powerful the system required.
Relational database storage and management technology is adequate for many data mining applications less than 50 gigabytes. However, this infrastructure needs to be significantly enhanced to support larger applications. Some vendors have added extensive indexing capabilities to improve query performance. Others use new hardware architectures such as Massively Parallel Processors (MPP) to achieve order-of-magnitude improvements in query time. For example, MPP systems from NCR link hundreds of high-speed Pentium processors to achieve performance levels exceeding those of the largest supercomputers.
Analyzing data in Excel
Microsoft Excel is one of the most indispensable software products. Excel has a wide functionality that finds application in absolutely any field.
Possessing the skills of working in this program, you can easily solve a very wide range of tasks. Microsoft Excel is often used for engineering or statistical analysis.
The program provides for the possibility of setting a special configuration, which will significantly help to facilitate the task.
Let's consider how to include data analysis in Excel, what it includes and how to use it.
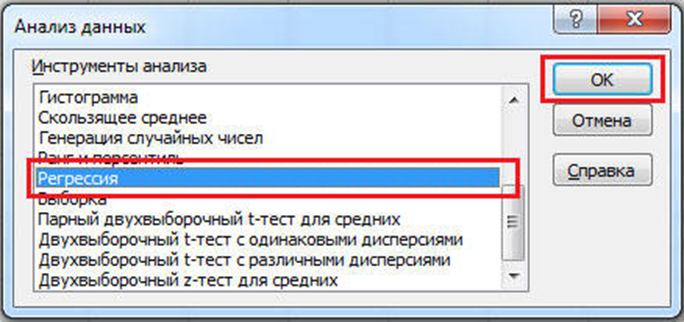
Figure 6.3 - Data analysis in Excel
The first thing to begin with is to install the add-in. The entire process will be examined using the example of Microsoft Excel 2010. This is done as follows. Click the "File" tab and click "Options", then select the "Add-ons" section. Next, find the "Excel Add-ins" and click on the "Go" button. In the opened window of available add-ins, select the "Analysis package" item and confirm the selection by clicking "OK".
Since you can still use the Visual Basic functions, it is also desirable to install the "VBA Analysis Package".
The installed package includes several tools that you can use depending on the tasks that you are facing. Let's consider the basic tools of the analysis:
Dispersion analysis is a method in mathematical statistics aimed at finding dependencies in experimental data by examining the differences in mean values.
Dispersion analysis studies the effect of one or more independent variables, called factors, on the dependent variable.
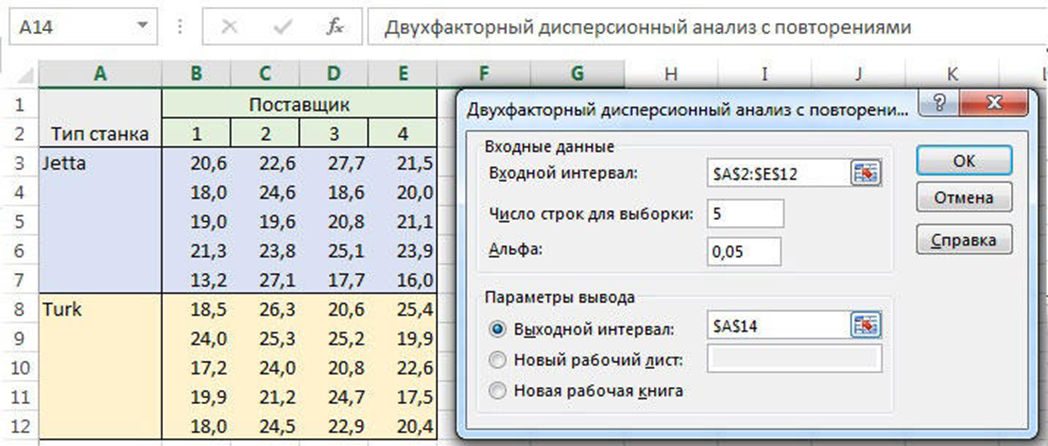
Figure 6.4 - Dispersion analysis
Correlation analysis. Allows you to determine whether the values of one data group are related to the values of another group.
For example, we measure the height and weight of a person, each dimension is represented by a point in two-dimensional space.
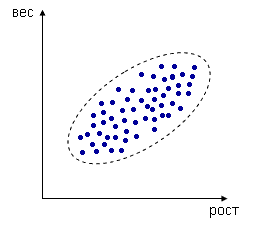
Figure 6.4 - Correlation analysis
In spite of the fact that the values are random, a certain dependence is generally observed - the values correlate.
In this case, this is a positive correlation (with increasing one parameter, the second one also increases).
If the correlation coefficient is negative, this means that there is an opposite relationship: the higher the value of one variable, the lower the value of the other.
Theory of algorithms
Algorithm - a system of rules that describes the sequence of actions that must be done to solve the problem.
Origins of the term "algorithm" associated with the name of the Uzbek mathematician and astronomer al-Khwarizmi (IX century), who developed the rules of the 4 arithmetic operations on multi-valued decimal numbers.
Presentation of algorithms
Verbal form of the algorithm - a verbal description of the action sequences.
Graphic form - a representation of the algorithm in the form of individual geometric shapes.
The pseudo-code - a description of the algorithm on a (conditional algorithmic language, which includes the elements of the programming language and natural language phrases.
Writing in the programming language - a text on programming languages.
Consider example.
Finding the greatest number of the two numbers X and Y.
Consider the record of the algorithm in verbal form.
We introduce the variable Max for maximum storage.
1. Enter the values of the numbers X and Y;
2. Comparison of X and Y;
3. If X is less than Y, write in Max variable value Y;
4. If X is greater than Y, write in Max variable value X.
As seen from this example, a verbal description has the following disadvantages:
- Description of the algorithm is not strictly formalized;
- Recording turns verbose;
- Some instructions allow the ambiguity.
The most popular solutions for this problems is a graphical presentation of the algorithm in the form of block diagrams.
Дата: 2019-02-02, просмотров: 705.